


About EvaCva-sustainable
EvaCva-sustainableis a tool that visualizes the regional wealth from the aspect of sustainability using open data.“Eva” stands for “Evaluate”, “Cva” stands for “City Value”. Combining the above, EvaCva-sustainable was named to “Find out and create values of regions.
It is necessary to control and utilize of regional capital that are sources of wealth for well-being in the future living. In EvaCva-sustainable, the value on the municipal district town and village of the Inclusive Wealth Index (Natural Capital, Human Capital, Produced Capital) and the ecosystem services are displayed.
- Calculating from statistical data disclosed by ministries and agencies in Japan, regional wealth of city, wards, towns or villages are graphed.
- Multiple local governments in Japan can be selected out of the 1,742 governments. (Cities, wards, towns and villages as of April 1, 2014)
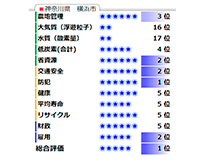
- Radar charts and rankings by deviation value of indexes related Inclusive Wealth and ecosystem servises, can be displayed.
- You can compare to all other local governments in Japan or to similar local governments (local governments of same population level).
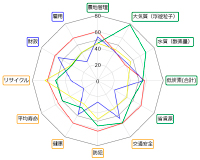
※Radar charts display the T-scores of indexes. The T-score is scaled to have a mean of 50 and a standard deviation of 10. The maximum and minimum scores are 80 and 20, respectively, and are displayed as 0 if data is not available (missing value).
※Please use Internet Explore 11 or Google Chrome for your browser.
Data Used
| Theme | Item name | Source of reference (in Japanese) | year |
|---|---|---|---|
| Produced Capital | Produced Capital | 内閣府 「県民総生産」 | 2010 |
| 内閣府 「投資額」 | 2010 | ||
| Human Capital | Educational Capital | 国勢調査 「卒業者数・在学者数」 | 2010 |
| 厚生労働省 「県民雇用者数」 | 2010 | ||
| Healthy Capital | 国立社会保障・人口問題研究所 「生命表の死亡数」 | 2010 | |
| 総務省 「年齢階層別人口」 | 2010 | ||
| Nature Capital | Forest(timber) | 農林水産省 「森林蓄積」 | 2010 |
| 農林水産省 「日本の樹種別素材価格・生産量」 | 2010 | ||
| Forest(non-timber) | 農林水産省 「全国林業粗収入・経営費」 | 2010 | |
| 農林水産省 「現状森林面積」 | 2010 | ||
| TEEB 「生態系と生物多様性の経済学(TEEB)評価データベース」 | 2010 | ||
| Agricultural land | 農林水産省 「作付面積」 | 2010 | |
| 農林水産省 「地域別粗収益、経営費」 | 2010 | ||
| Fishery | 農林水産省 「海面漁業の漁獲量」 | 2010 | |
| 農林水産省 「日本の海面漁業粗収益、経営費」 | 2010 | ||
| 農林水産省 「海面漁業生産額・生産量」 | 2010 | ||
| Minerals | 「年時点で採掘可能な鉱山数」 | 2010 | |
| 資源エネルギー省 「日本の金・銀・亜鉛の蔵鉱量」 | 2010 | ||
| 国民経済計算 「日本の鉱業所得・産出額」 | 2010 | ||
| 世界銀行・世界経済観測 「日本の市場価格」 | 2010 | ||
| Adjustment factors | Resource trade among others | 財務省貿易統計 「輸入材9品目の純輸入額」 | 2010 |
| Carbon damage by climate change | 環境省「部門別二酸化炭素排出量の現況推計」 | 2010 | |
| Regulating services | Vegetation | 環境省 第2~7回自然環境保全基礎調査植生調査 | 1979~ |
| Administrative district | 国土交通省 国土数値情報「行政区域データ」 | 2014 | |
| Surface geology | 国土交通省 国土数値情報「土地分類メッシュ」 | 1979 | |
| Annual precipitation | 国土交通省 国土数値情報「平年値(気候)メッシュ」 | 2010 | |
| Latitude longitude of municipality’s office | 国土交通省 国土数値情報「市町村役場等及び公的集会施設データ」 | 2010 | |
| Nature | Land area (ha) | 農林水産省「農林漁業センサス」 | 2010 |
| Forest area (ha) | |||
| Management farmland area (ha) | |||
| Cultivation abandonment area (ha) | |||
| Air quality | Oxidant density (ppm) | (独)国立環境研究所「環境数値データベース」大気環境月間値・年間値データファイル | 2012 |
| SPM density (mg/m3) | |||
| CO density (ppm) | |||
| SO2 density (ppm) | |||
| Water quality | pH | (独)国立環境研究所「環境数値データベース」公共用水域水質年間値データファイル | 2013 |
| BOD density (mg/l) | |||
| SS density (mg/l) | |||
| DO density (mg/l) | |||
| Number of the coliform bacteria (MPN/100ml) | |||
| CO2 emissions | CO2 emissions (industrial sector) (t-CO2) | 環境省 地球温暖化対策地方公共団体実行計画 (区域施策編)策定支援サイト 「部門別CO2排出量の現況推計」 |
2012 |
| CO2 emissions (household) (t-CO2) | |||
| CO2 emissions (commercial sector) (t-CO2) | |||
| CO2 emissions (transportation sector) (t-CO2) | |||
| CO2 emissions (waste disposal) | |||
| Resources consumption | Amount of waste (t) | 環境省大臣官房廃棄物・リサイクル対策部廃棄物対策課 「日本の廃棄物処理」(一般廃棄物処理事業実態調査結果を取りまとめたもの) |
2012 |
| Amount of final disposal (t) | |||
| Chemical substance discharge | Chemical substance discharge amount to the atmosphere (kg) | 経済産業省製造産業局化学物質管理課 「PRTRデータ分析システム」 |
2010 |
| Chemical substance discharge amount to the public waters (kg) | |||
| Toxic coefficient to human health | 神奈川県 環境農政局環境部大気水質課調整グループ 「化学物質の安全性影響度の評価について」 |
2005 | |
| Toxic coefficient to ecosystem | |||
| Security/Safety | Population | 総務省統計局「国勢調査」 | 2010 |
| Number of traffic accidents | 警察庁交通局交通企画課「交通統計」 | 2009 | |
| Number of recognized crimes | 警察庁「犯罪統計書」 | 2009 | |
| Number of building fires | 総務省消防庁防災課防災情報室 火災年報 | 2012 | |
| Health, medical care | Medical treatment costs per National Health Insurance person insured (yen) | 厚生労働省保健局調査課 国民健康保険事業年報 | 2012 |
| Average life expectancy [man] | 厚生労働省平成22年市区町村別生命表 | 2010 | |
| Average life expectancy [woman] | |||
| Number of hospitals | 厚生労働省大臣官房統計情報部人口動態・保健統計課保健統計室 医療施設調査 | 2012 | |
| Social foundation | Number of elementary school teachers | 文部科学省 生涯学習政策局調査企画課 「学校基本調査」 |
2013 |
| Number of elementary school students | |||
| Number of junior high school teachers | |||
| Number of junior high school students | |||
| Number of public halls | 文部科学省大臣官房調査統計企画 「社会教育調査」 | 2011 | |
| Number of libraries | |||
| Elderly population over 65 | 総務省統計局「国勢調査」 | 2010 | |
| Number of welfare facility for the aged | 厚生労働省大臣官房統計情報部人口動態・保健社会統計課社会統計室「社会福祉施設等調査」 | 2012 | |
| Number of nursing home for elderly | 厚生労働省大臣官房統計情報部人口動態・保健社会統計課社会統計室「介護サービス施設・事業所調査」 | 2012 | |
| Number of the pay nursing homes | 厚生労働省大臣官房統計情報部人口動態・保健社会統計課社会統計室「社会福祉施設等調査」 | 2012 | |
| 0-5 years old population | 総務省統計局「国勢調査」 | 2010 | |
| Number of nurseries | 厚生労働省大臣官房統計情報部人口動態・保健社会統計課社会統計室「社会福祉施設等調査」 | 2012 | |
| Number of general administrative officials | 総務省自治行政局公務員部公務員課給与能率推進室 「地方公共団体定員管理調査」 |
2013 | |
| Total number of houses | 総務省統計局統計調査部国勢統計課 「住宅・土地統計調査」 | 2008 | |
| Number of empty houses | |||
| Sewage coverage | 国土交通省 全国市町村別 「汚水処理人口普及率一覧」 | 2014 | |
| City park area (ha) | 国土交通省都市・地域整備局都市計画課 「都市計画年報」 | 2012 | |
| Total household | 総務省統計局統計調査部国勢統計課 「住宅・土地統計調査」 | 2008 | |
| Number of housing starts | |||
| Living environments | Waste recycle rate (%) | 環境省大臣官房廃棄物・リサイクル対策部廃棄物対策課 「日本の廃棄物処理」(一般廃棄物処理事業実態調査結果を取りまとめたもの) |
2012 |
| Number of main households (households) | 総務省統計局統計調査部国勢統計課 「住宅・土地統計調査」 | 2008 | |
| Number of main households with more than minimum living floor space (households) | |||
| Activity | Number of births | 厚生労働省大臣官房統計情報部人口動態・保健社会統計課 「人口動態調査」 |
2013 |
| Number of deaths | |||
| Total fertility rate | 厚生労働省大臣官房統計情報部人口動態・保健社会統計課 「人口動態統計特殊報告」 |
2012 | |
| Number of people moving in | 総務省統計局統計調査部国勢統計課 「住民基本台帳人口移動報告」 |
2013 | |
| Number of people moving out | |||
| Finance | Amount of agriculture production (million yen) | 農林水産省大臣官房統計部経営・構造統計課 「生産農業所得統計」 | 2006 |
| Amount of manufactured goods shipped (million yen) | 経済産業省大臣官房調査統計グループ構造統計室 「工業統計調査」 | 2012 | |
| Annual sales of commercial goods (million yen) | 経済産業省大臣官房調査統計グループ構造統計室 「商業統計調査」 | 2011 | |
| Local tax (thousand yen) | 総務省自治財政局財務調査課 「地方財政状況調査」(都道府県決算状況調・市町村別決算状況調) |
2012 | |
| Financial index | 2012 | ||
| Taxable income(per taxpayer) (thousand yen) | 総務省自治税務局市町村税課 「市町村税課税状況等の調」 | 2013 | |
| Real debt service ratio (municipality finance) (%) | 総務省自治財政局財務調査課 地方財政状況調査(都道府県決算状況調・市町村別決算状況調) |
2012 | |
| Employment | Completely unemployment rate (%) | 総務省統計局「国勢調査」 | 2010 |
Definition of Indicators
| Category | Theme | Index | Index in radar chart | Explanation | Definition |
|---|---|---|---|---|---|
| Inclusive wealth index | Municipality information | Population | Population | Population used to calculate capital to population(person) | More details can be found here (in Japanese) |
| area | area | Area used to calculate capital to area(km2) | |||
| Produced Capital | Produced Capital | Produced Capital | Equipment, Machineries, Road, among others (hundred million yen) | ||
| Produced Capital (per person) | Produced Capital [/person] | Produced Capital per person (million yen) | |||
| Produced Capital (per area) | Produced Capital [/km2] | Produced Capital per area(hundred million yen) | |||
| Human Capital | Educational Capital | Educational Capital | Capital connected with revenue by education and training(hundred million yen) | ||
| Healthy Capital | Healthy Capital | Capital of long life(hundred million yen) | |||
| Human Capital | Human Capital | Educational capital + Healthy capital (hundred million yen) | |||
| Educational Capital (per person) | Educational Capital [/person] | Educational Capital per person (million yen) | |||
| Healthy Capital (per person) | Healthy Capital[/person] | Healthyl Capital per person (million yen) | |||
| Human Capital (per person) | Human Capital [/person] | Human Capital per person (million yen) | |||
| Educational Capital (per area) | Educational Capital [/km2] | Educational Capital per(hundred million yen) | |||
| Healthy Capital (per area) | Healthy Capital[/km2] | Educational Capital per(hundred million yen) | |||
| Human Capital (per area) | Human Capital [/km2] | Educational Capital per(hundred million yen) | |||
| Nature Capital | Forest(Timber) | Forest(Timber) | Value when natural forest is consumed in market such as wood(hundred million yen) | ||
| Forest(Non-Timber) | Forest(Non-Timber) | Value of ecosystem that provides ecosystem service(hundred million yen) | |||
| Agricultural land | Agricultural land | Value as farmland where farm products are produced(hundred million yen) | |||
| Fishery | Fishery | Value as fishery in surface of the sea(hundred million yen) | |||
| Natural Capital | Natural capital | Forest(timber and non-timber)+Agricultural land+Fishery (hundred million yen) | |||
| Natural capital(per person) | Natural capital[/person] | Natural capital to population(million yen) | |||
| Natural capital(per area) | Natural capital[/km2] | Natural capital to area(hundred million yen) | |||
| Adjustment factors | resource trade | resource trade | Few of depletion of natural capital of another country by trade(hundred million yen) | ||
| Carbon damage | Carbon damage | Few of depletion of natural capital by carbon dioxide emission(hundred million yen) | |||
| IWI(Inclusive wealth index) | IWI | IWI | Produced Capital+Human Capital+Nature Capital (hundred million yen) | ||
| IWI (per person) | IWI [/person] | IWI per person (million yen) | |||
| IWI (per area) | IWI [/km2] | IWI per area (hundred million yen) | |||
| Adjusted IWI | Adjusted IWI | IWI-(resource trade + Carbon damage) (hundred million yen) | |||
| Adjusted IWI (per person) | Adjusted IWI [/person] | Adjusted IWI per person (million yen) | |||
| Adjusted IWI (per area) | Adjusted IWI [/km2] | Adjusted IWI per person (hundred million yen) | |||
| Simulated IWI(Inclusive wealth index) | Simulated IWI of 2050year | Simulated IWI of 2050year | IWI of 2050year simulated on the BAU scenario in SSP (billion yen) | ||
| Simulated IWI of 2100year | Simulated IWI of 2100year | IWI of 2100year simulated on the BAU scenario in SSP (billion yen) | |||
| Simulated population of 2050year | Simulated population of 2050year | population of 2050year simulated on the BAU scenario in SSP | |||
| Simulated population of 2100year | Simulated population of 2100year | population of 2100year simulated on the BAU scenario in SSP | |||
| Simulated IWI per person of 2050year | Simulated IWI of 2050year [/person] | Simulated IWI per person of 2050year simulated on the BAU scenario in SSP(million yen) | |||
| Simulated IWI per person of 2100year | Simulated IWI of 2100year [/person] | Simulated IWI per person of 2100year simulated on the BAU scenario in SSP(million yen) | |||
| Ecosystem service | Regulating servise(each index) | Surface erosion prevention (per area) | Surface Erosion | High degree of surface erosion rate | More details can be found here (in Japanese) |
| Surface collapse prevention (per area) | Surface Collapse | High degree of surface collapse rate | |||
| Soil erosion prevention (per area) | Soil Erosion | High degree of soil erosion rate | |||
| Water storage (per area) | Water Storage | High degree of water storage rate | |||
| Water purification (per area) | Water Purification | High degree of water purification rate | |||
| Carbon dioxide absorption (per area) | Carbon Storage | High degree of carbon storage rate | |||
| Air Purification (per area) | Air Purification | High degree of air purification rate | |||
| Fossil Fuel Substitution (per area) | Fossil Fuel Substitution | High degree of fossil fuel substitution rate | |||
| Climate mitigation (per area) | Climate Mitigation | High degree of climate mitigation rate | |||
| Regulating service(total) | Regulating servise | Regulating servise | High degree of regulating services (hundred million yen) | ||
| Regulating servise(per area) | Regulating servise [/km2] | High degree of regulating services per land area (hundred million yen) | |||
| Regulating servise(per person) | Regulating servise [/person] | High degree of regulating services per pewrson (million yen) | |||
| Provisioning service | Provisioning service | Provisioning service | High degree of Provisioning service ((hundred million yen) | ||
| Provisioning service (per area) | Provisioning service [/km2] | High degree of Provisioning service per land area (hundred million yen) | |||
| Provisioning service (per person) | Provisioning service [/person] | High degree of Provisioning service per person (million yen) | |||
| Ecosystem service | Ecosystem service | Ecosystem service | High degree of Regulating services(total)+Provisioning service(hundred million yen) | ||
| Ecosystem service (per area) | Ecosystem service[/km2] | High degree of Ecosystem servises per area (hundred million yen) | |||
| Ecosystem service (per person) | Ecosystem service [/person] | High degree of Ecosystem servises per person (million yen) | |||
| Environment | Nature | Rate of forest area | Forest | High degree of forest area to total land area | Forest area (ha)/Land area (ha) |
| Rate of cultivation abandonment area | Agricultural Land Management | Low degree of cultivation abandonment area to total land area | Cultivation abandonment area (ha)/{Cultivation abandonment area (ha)+Management farmland area (ha)} | ||
| CO2 absorption in forest area | CO2 Absorption | High degree of CO2 absorption to forest area | Forest area (ha)×Absorption basic unit(2.92t-CO2/ha) | ||
| Air quality | Oxidant concentration | Air Quality (Oxidant) | Low degree of concentration of oxidant in atmosphere | Average of {oxidant density (ppm)} at every measurement places | |
| SPM concentration | Air Quality (Suspended Particulate Matter) | Low degree of concentration of suspended particulate matter in atmosphere | Average of {SPM density (mg/m3)} at every measurement places | ||
| CO concentration | Air Quality (Carbon Monoxide) | Low degree of concentration of carbon monoxide in atmosphere | Average of {CO density (ppm)} at every measurement places | ||
| SO2 concentration | Air Quality (Sulfur Dioxide) | Low degree of concentration of sulfur dioxide in atmosphere | Average of {SO2 density (ppm)} at every measurement places | ||
| Water quality | pH | Water Quality (pH) | Low degree of acidity/alkalinity in water area | Average of (|pH-7|) at every measurement places | |
| BOD | Water Quality (Biochemical Oxygen Demand) | Low degree of concentration of biochemical oxygen demand in water area | Average of {BOD density (mg/l)} at every measurement places | ||
| SS | Water Quality (Suspended Solids) | Low degree of concentration of suspended solids in water area | Average of {SS density (mg/l)} at every measurement places | ||
| DO | Water Quality (Dissolved Oxygen) | High degree of concentration of dissolved oxygen in water area | Average of DO density (mg/l) at every measurement places | ||
| Coliform bacteria concentration | Water Quality (Coliform Bacteria) | Low degree of concentration of coliform bacteria in water area | Average of number of the {coliform bacteria (MPN/100ml)} at every measurement places | ||
| CO2 emissions | CO2 emissions (industrial section) | Low Carbon (Industry) | Low degree of industrial sector-emitted CO2 to population | CO2 emissions (industrial sector) (t-CO2) / Population | |
| CO2 emissions (household section) | Low Carbon (Household) | Low degree of household-emitted CO2 to population | CO2 emissions (household) (t-CO2) /Population | ||
| CO2 emissions (commercial sector) | Low Carbon (Civil Business) | Low degree of commercial sector-emitted CO2 to population | CO2 emissions (commercial sector) (t-CO2)/Population | ||
| CO2 emissions (transportation sector) | Low Carbon (Transportation) | Low degree of transportation sector-emitted CO2 to population | CO2 emissions (transportation sector) (t-CO2) / Population | ||
| CO2 emissions (disposal sector) | Low Carbon (Waste) | Low degree of waste disposal-emitted CO2 to population | CO2 emissions (waste disposal) /Population | ||
| Resources consumption | Amount of waste | Resource Conservation | Low degree of amount of waste per person | Amount of waste (t) / Population | |
| Amount of final disposal | Waste Reduction | Low degree of amount of final disposal to population | Amount of final disposal (t) / Population | ||
| Chemical substance discharge | Human health impact | Health Maintenance | Low degree of human health impact by chemical substances | Total of {Chemical substance discharge to the atmosphere (kg) × Toxic coefficient to human health}/Land area (km2) | |
| Ecological impact | Ecosystem Conservation | Low degree of ecological impact by chemical substances | Total of {Chemical substance discharge to the public waters (kg) ×Toxic coefficient to ecosystem} / Land area (km2) | ||
| Sociaty & Economy | Security/Safety | Number of traffic accidents | Traffic Safety | Low degree of number of traffic accidents to population | Number of traffic accidents/Population |
| Number of recognized crimes | Security | Low degree of number of recognized crimes to population | Number of recognized crimes/Population | ||
| Number of fires | Fire Prevention | Low degree of number of fires to population | Number of building fires/Population | ||
| Health, medical care | National health insurance expenses | Health | Low degree of national health insurance expenses to population | Medical treatment costs per National Health Insurance person insured (yen) | |
| Average life Expectancy | Life Expectancy | High degree of average life expectancy at birth | {Average life expectancy [man] + Average life expectancy [woman]}/2 | ||
| Social foundation | Number of nurseries | Child Welfare | High degree of number of nurseries to population of children less than 6 years old | Number of nurseries/0-5 years old population | |
| Number of general administrative officials | Administrative Service | High degree of number of general administrative officials to population | Number of general administrative officials/Population | ||
| City park area | Park Area | High degree of larger park area to population | City park area (ha) /Population | ||
| Number of housing starts | Housing Starts | High degree of number of housing starts to total number of houses | Number of housing starts/Total number of houses | ||
| Living environments | Waste recycling rate | Recycle | High degree of waste recycling rate | Waste recycling rate (%) | |
| Fulfillment of the housing standard | Comfortable Dwelling Level | High degree of number of households with more than minimum living floor space to total number of households | Number of households with more than minimum living floor space/ Number of the households | ||
| Activity | Natural population growth rate | Natural Population Growth | High degree of {number of births – number of deaths} to population | {Number of births – Number of deaths}/Population | |
| Finance | Municipal GDP | Municipal GDP | High degree of {amount of agricultural product + amount of manufactured goods shipped + annual sales of commercial goods} to population | Amount of agriculture production (million yen)+Amount of manufactured goods shipped (million yen) + Annual sales of commercial goods (million yen) }/ Population | |
| Financial index | Finance | High degree of financial index | Financial index | ||
| Employment | Completely unemployment rate | Employment | Low degree of completely unemployment rate | Completely unemployment rate (%) |
About Simulated IWI :This index value is based on the simulation as of March 5,2018 calculated based on the BAU(Business as usual) scenario in SSP (Shared Socio-Economic Pathways).Fishery capital and adjustment items are not included in this simulation.
Definition of Local Government Type
Types of local governments refer to groups defined according to the chart below.
Rankings and scores on graphs displayed with “ In type ” indicate results calculated within the same group only.
| Type | Definition | Number | |
|---|---|---|---|
| 1 | Town (small) | Towns and villages of less than 5,000 people | 239 |
| 2 | Town (medium) | Towns and villages from 5,000 to less than 15,000 people | 388 |
| 3 | Town (large) | Towns and villages of 15,000 people or more | 302 |
| 4 | City (small) | Cities of less than 50,000 people | 252 |
| 5 | City (medium) | Cities from 50,000 to less than 100,000 people | 270 |
| 6 | City (large) | Cities of 100,000 people or more | 164 |
| 7 | Special city | Cities of 200,000 people or more (specified by government ordinance) | 39 |
| 8 | Core city | Cities of 200,000 people or more (specified by government ordinance) | 45 |
| 9 | Designated city | Cities of 500,000 people or more (specified by government ordinance) | 20 |
| 10 | Special ward | Tokyo 23 wards | 23 |
- Each local government was classified based on the population in 2010.